6 Best Claude Code Prompts to Make Research Presentations Look Less AI-Generated in 2026
6 copy-ready Claude Code prompts for research slides: remove card grids, fix color and font size, enlarge the evidence, tighten claims and audit the deck. Two tested on a sample deck.
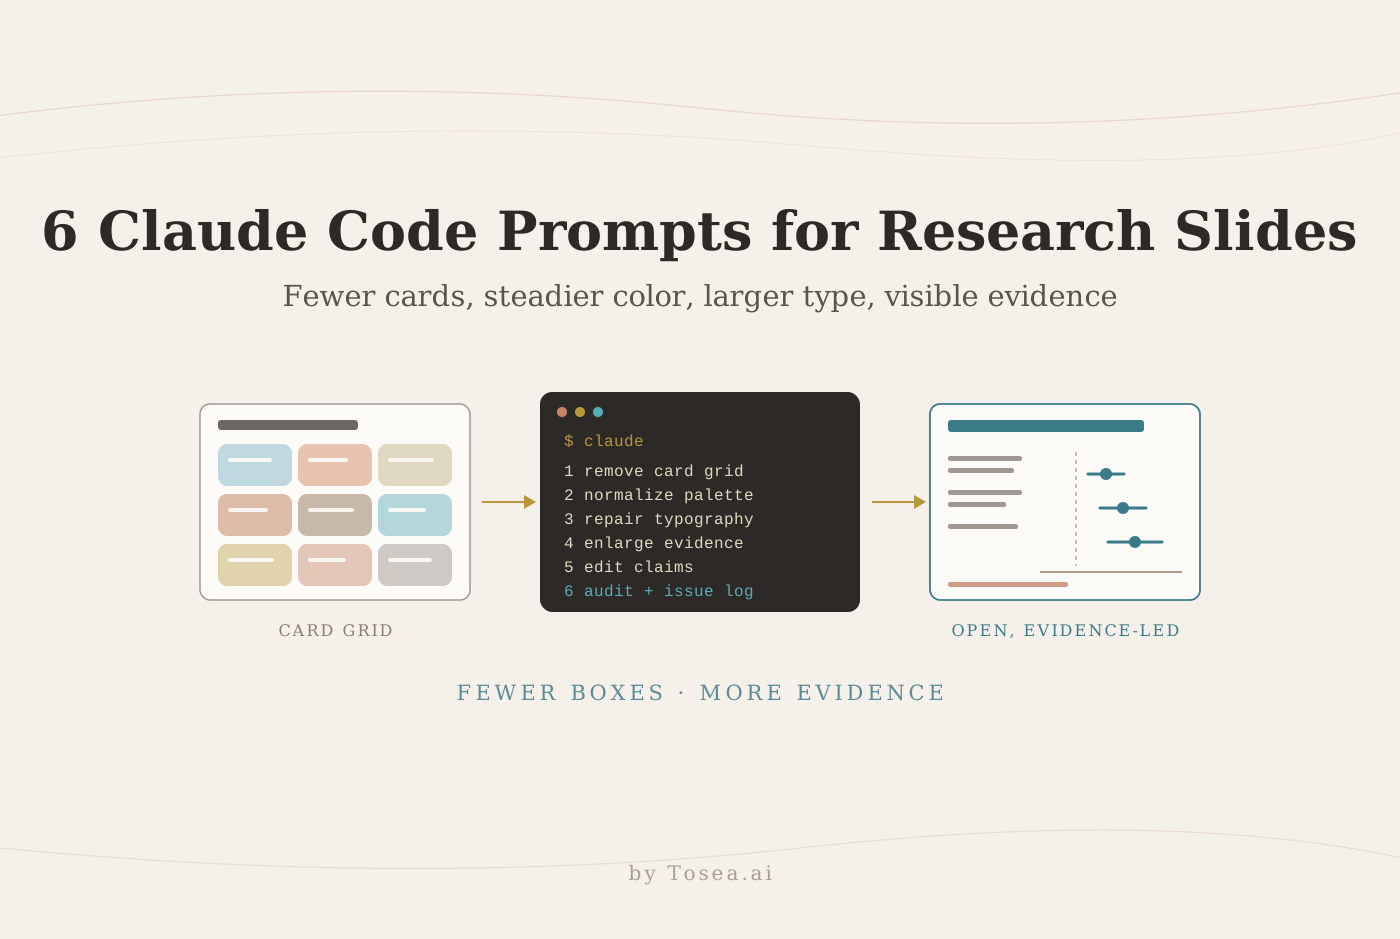
These Claude Code prompts for research presentations address a familiar problem: the evidence may be sound, but the slides look like a stack of colored cards with tiny text. Start with fewer containers, a restrained palette, and readable typography. Then give each research claim a visual structure that fits its evidence. Claude Code can make those edits on an editable deck when the project has the right tools, and Tosea AI covers the same ground from the other direction: it turns papers, documents, and data into presentations, with a reviewable outline, templates, visual editing, and PowerPoint export.
The six prompts below are editorial recommendations for 2026, not a benchmark ranking. The six before-and-after illustrations are original schematics with fictional content. They demonstrate design choices, not measured differences between AI and human authorship. We did run two of the prompts on a fictional test deck, and the results are reported below.
What makes a research presentation feel AI-generated?
Repeated rounded boxes, unrelated accent colors, and small labels can make a deck feel generic. None proves who created it. The practical question is whether the audience can follow the argument and inspect the evidence.
Reduce cards and use transparent text boxes
A text box does not need a visible background. Use no-fill, no-outline text boxes on a shared slide background, with spacing and alignment to separate ideas. Keep containers when they communicate something specific, such as study groups or competing hypotheses. Six equal cards rarely explain which result matters most.
Give color a stable meaning
Choose a neutral background, dark text, and one principal accent. Keep treatment groups consistent across figures. Preserve established scientific color conventions where necessary. Add labels or marker shapes so color carries no essential meaning by itself, consistent with Microsoft's PowerPoint accessibility guidance, which asks authors to make sure color is not the only means of conveying information.
Increase type before adding decoration
For a projected 16:9 research talk, try 32 to 40 pt titles and 24 to 28 pt body text as starting points. These are editorial defaults, not universal requirements. University of Colorado Boulder guidance recommends a readable sans-serif font of at least 18 point. Dense figure labels often need enlargement or a separate slide. Test the actual projection environment. Our guide to aesthetic academic conference slides goes deeper on type and spacing for conference rooms.
Before using the prompts in Claude Code
Put the approved paper, figures, data, and editable slide source in the project. Identify the audience, talk length, and immutable content. Tell Claude Code which slide-generation library and renderer are available. Its common workflows documentation explains referencing project files and using plan mode, where Claude reads files and proposes a plan before making edits. A prompt alone does not supply PowerPoint libraries or rendering tools.
In practice, that means three things for a .pptx file:
- An editing library. python-pptx can read and change shapes, text, fills, and native charts. Anthropic's pptx skill, covered in our Claude Code skills for PowerPoint roundup, packages similar tooling.
- A renderer. Claude Code can only judge layout from images. A headless LibreOffice install converts the deck to PDF, and a PDF library turns pages into PNG previews that Claude can open and inspect.
- A source of truth. A short summary or the paper itself, so numbers on the slides can be compared with something other than the slides.
For an existing PPTX, keep a backup and require an object inventory. For a flattened PDF, editability requires reconstruction. If the environment cannot render or inspect the deck, require that limitation in the delivery report.
| Visible problem | Use prompt | Expected deliverable |
|---|---|---|
| Every idea sits inside a card | 1. Remove unnecessary containers | Open, aligned layout |
| Colors change without meaning | 2. Normalize the palette | Consistent series mapping |
| Text needs zooming | 3. Repair typography | Readable slide hierarchy |
| Evidence gets less space than summaries | 4. Rebuild the results slide | Enlarged figure and qualified claim |
| Copy sounds generic | 5. Edit research language | Specific, source-backed wording |
| Individual fixes break deck consistency | 6. Audit the whole presentation | Rendered deck and issue log |
What happened when we ran two of the prompts
To see how the prompts behave on a real file, we built a fictional five-slide seminar deck with python-pptx, "Peer Tutoring and First-Year Chemistry Pass Rates." It reproduces the look this article describes: 17 rounded, filled shapes in 17 different colors, text as small as 8 pt, and a bar chart whose value axis starts at 56. A one-page summary served as the approved source. We also planted four errors: "+12 points" where the source says 9 percentage points, "n = 420" where the source says 408, "Tutoring causes better chemistry performance" in an observational study, and a "Revolutionary Breakthrough" conclusion slide.
We ran prompt 1 and prompt 6 once each, with only the bracketed fields filled in, in fresh headless Claude Code sessions using Claude Opus 5.5. Each session received a one-paragraph project note naming python-pptx, PyMuPDF, and LibreOffice as the available tools. Prompt 1 took 9 minutes 20 seconds over 42 turns; prompt 6 took 8 minutes 13 seconds over 38 turns. We did not rely on the sessions' own reports: we diffed the text of each revised deck against the original with python-pptx and checked fills, font sizes, and the chart axis directly.
| Check | Prompt 1 (remove cards) | Prompt 6 (deck audit) |
|---|---|---|
| Four planted errors | All four flagged, none changed | All four logged as Critical, none changed |
| Filled shapes after the pass | 0 of 17 | 17, reduced to two tints |
| Body text | 18 pt (source line 12 pt) | 16 pt (source line 12 pt) |
| Axis starting at 56 | Flagged, left unchanged | Reset to 0–100, value labels added |
| Wording | Same words on every slide; methods sentences reordered and disclosed | Same words on every slide; methods paragraph split into bullets |
| Rendering limits | LibreOffice only, PowerPoint not checked (stated) | Same, stated |
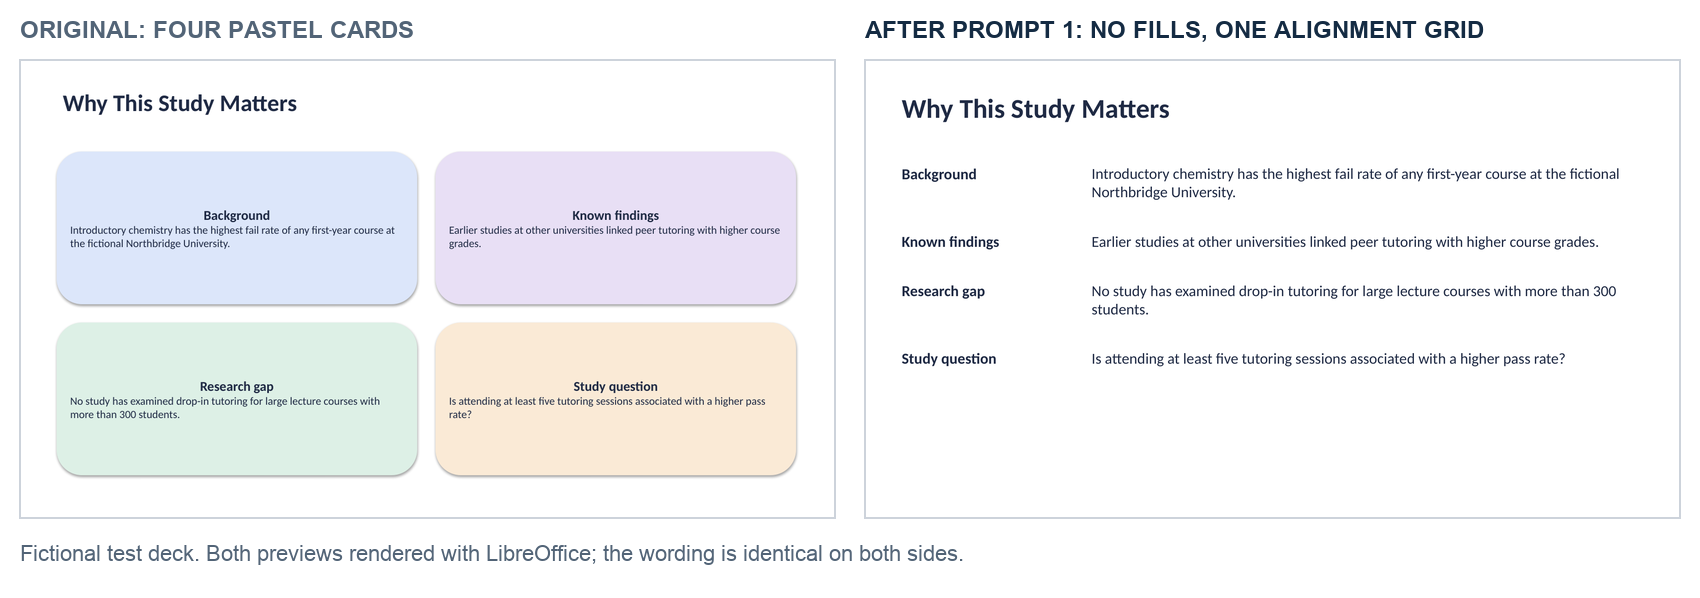
Prompt 1 did what it asks for and no more. Removing every card turned the motivation slide into a readable list of labels and sentences. The misleading chart stayed, because the prompt covers containers, not charts. The session still noticed the truncated axis and asked before touching it. It described the 71% bar as "about three times" the 62% bar; on an axis starting at 56, the ratio is 2.5.
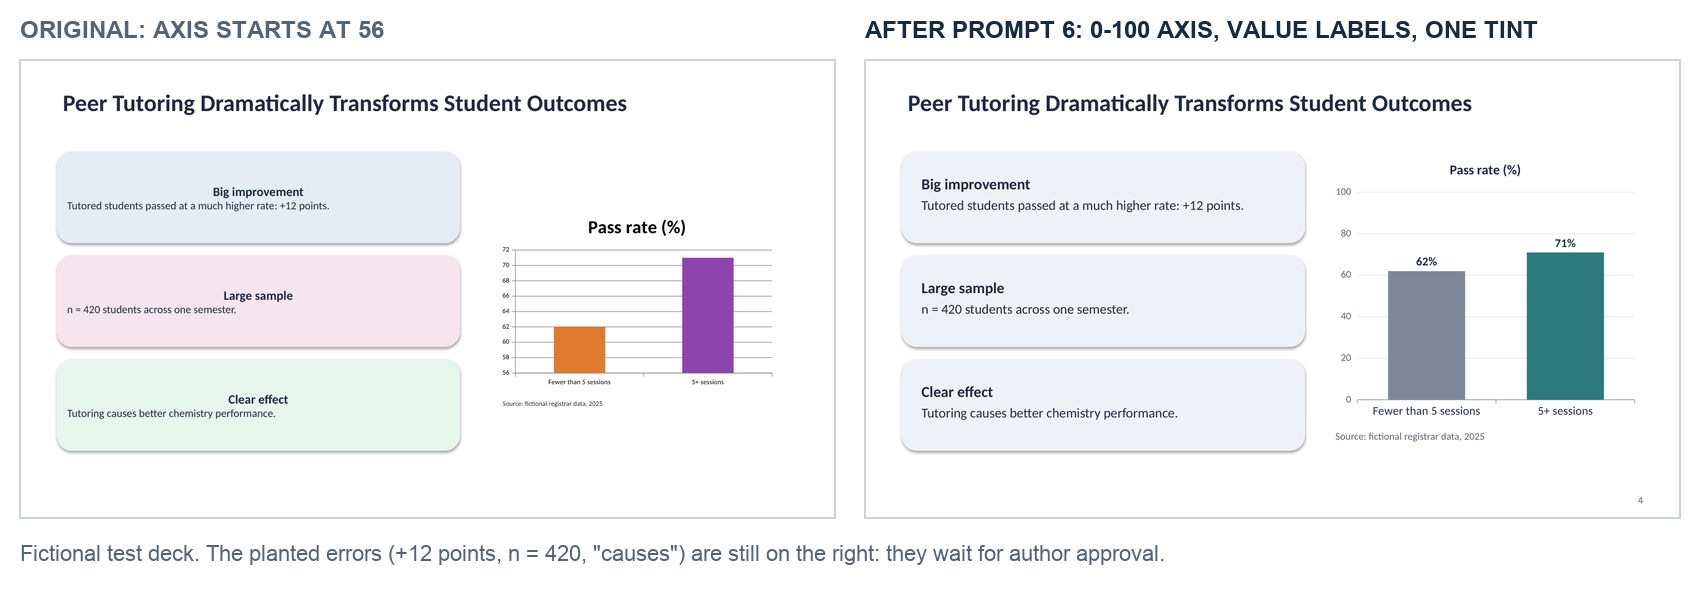
Prompt 6 fixed the evidence problem but kept the card look. It judged the cards acceptable, reduced 17 fill colors to two tints, and moved on to the chart. That is why the audit works as a final pass rather than a substitute for prompt 1.
The most useful finding was one we did not plant. Prompt 6 reported that the source's own confidence interval, 0.3 to 17.8 percentage points, could not be reproduced from the rounded percentages. It was right: we had typed that interval by hand when building the test. Of the four whole-number count combinations that round to 71% and 62%, three give a Wald interval that crosses zero. A design prompt that compares slide numbers with the source ended up checking the source as well.
Both sessions ended with an approval list instead of rewritten claims, which is the job of the "request approval" lines in the prompts. This was one fictional deck and one run per prompt, not a benchmark. Decks with labels baked into images, SmartArt, or linked charts will expose more limits.
1. Remove the card grid without losing content
Use this when a literature review, motivation slide, or method overview looks like a dashboard. Preserve grouping through headings and proximity. A boundary can disappear while the conceptual structure remains.
Review [slide source] for a [duration]-minute research talk to [audience]. Inventory every text block, figure, caption, and citation. Replace unnecessary rounded cards with no-fill, no-outline text boxes on the slide background. Use a shared alignment grid and whitespace. Retain boxes only when they encode a meaningful group or comparison. Preserve all approved wording and images. If content cannot fit at readable sizes, propose a split for approval. Return the revised editable source, a rendered preview, and a content-preservation checklist. Report anything you could not inspect.
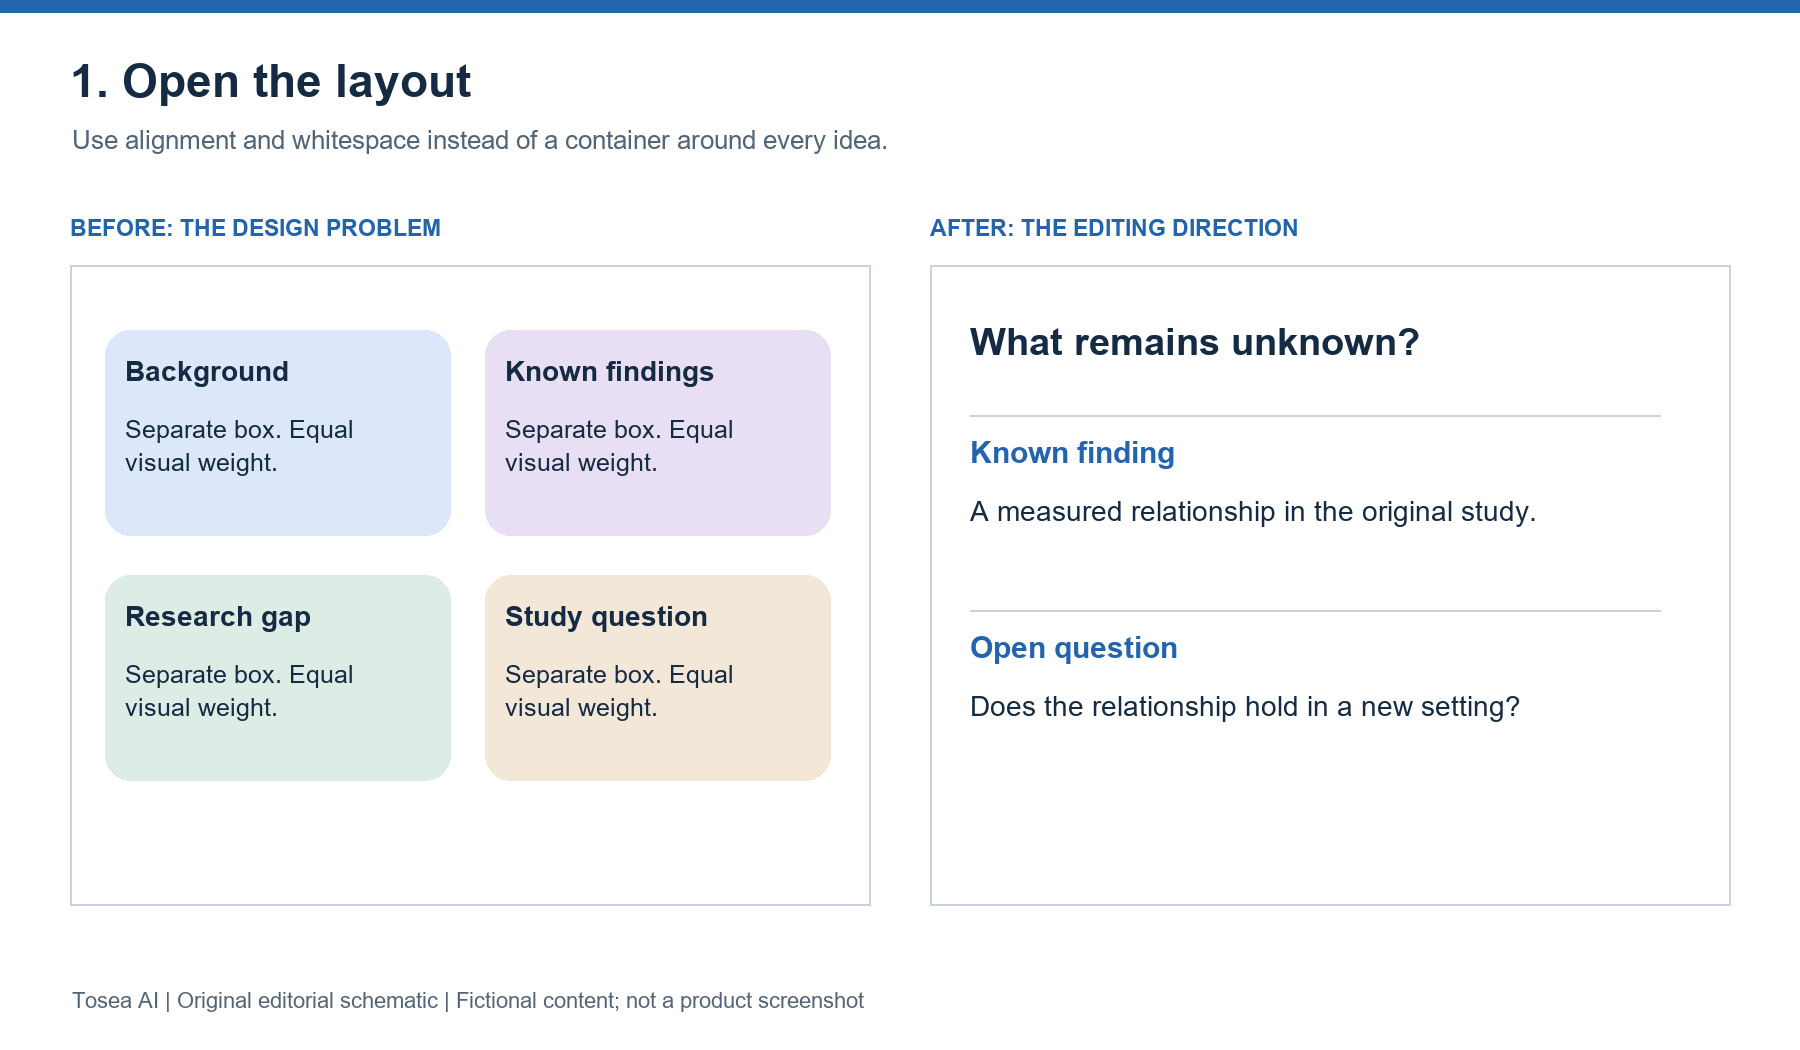
Example: A four-card motivation slide becomes a research question above two aligned sections: the known finding and the unresolved gap. The relationship becomes visible without adding a diagram.
2. Replace abrupt colors with a scientific palette
A different color for every sentence creates competing signals. Use a palette tied to the study rather than a decorative rainbow. Check figure legends before changing anything.
Audit [deck] for inconsistent color meaning. Create a palette using a white background, dark navy text, neutral gray, and one blue accent. Retain required institutional colors and scientific conventions. Map each study group to one consistent color across all slides. Add direct labels or marker differences where color currently carries essential meaning alone. Preserve data, axes, uncertainty intervals, and significance annotations. List the original and replacement color mappings. Render the revised slides and flag low contrast or ambiguous legends. Do not recolor source figures if doing so could change their interpretation.
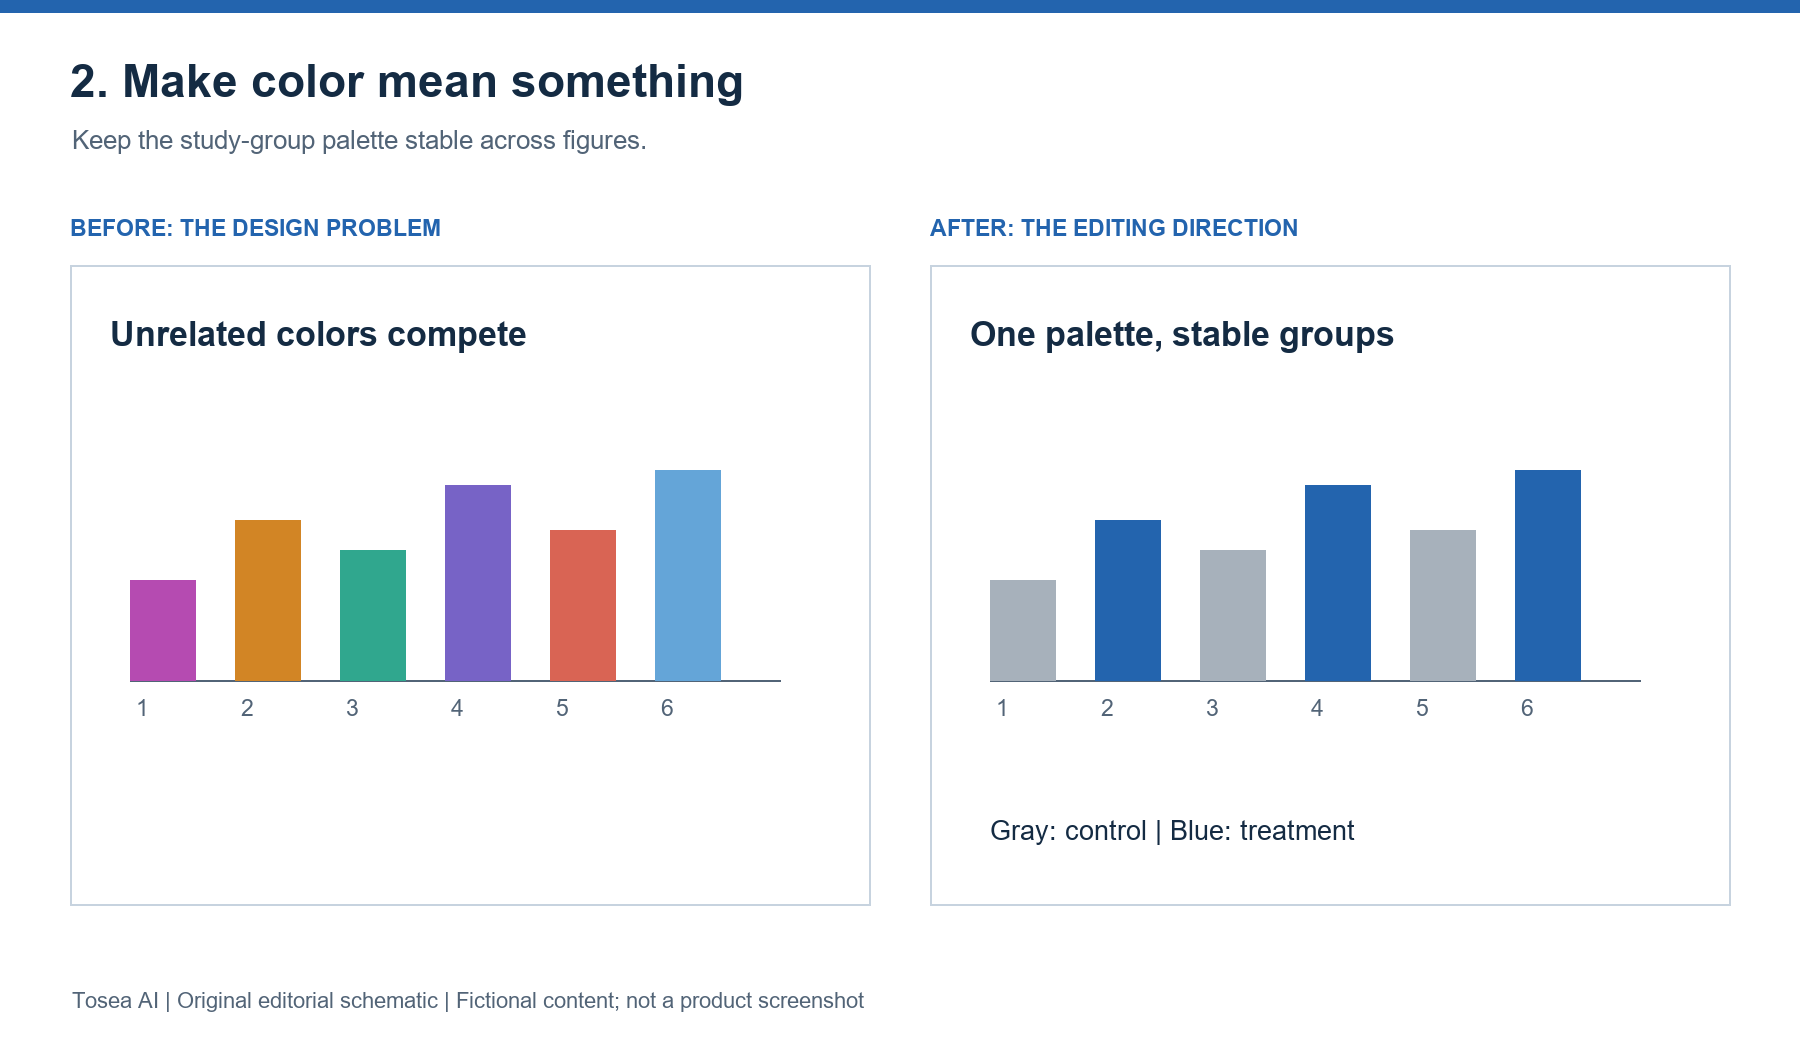
Example: Control remains gray and treatment remains blue across the talk. A warning color appears only for a predefined safety issue, rather than every secondary number. The schematic above still relies on a legend; on a real slide, a direct group label under each bar pair would satisfy the prompt's "color carries no essential meaning alone" rule more completely.
3. Fix tiny fonts without silently deleting evidence
Typography problems often reveal an overloaded slide. Enlarging text should trigger a layout decision, not an automatic loss of qualifiers or footnotes.
Inspect [deck] for projected readability. Start with 36 pt titles, 26 pt body text, and at least 18 pt essential figure labels on a 16:9 slide. Treat these as adjustable targets. Report font sizes, clipping, overflow, and crowded labels. Preserve every approved word, number, unit, reference, and figure. Enlarge evidence panels and simplify spacing before proposing content changes. When a slide remains overloaded, propose a two-slide split or an appendix move for approval. Return editable slides and previews. If labels are embedded in an image, flag them rather than claiming their font size was changed.
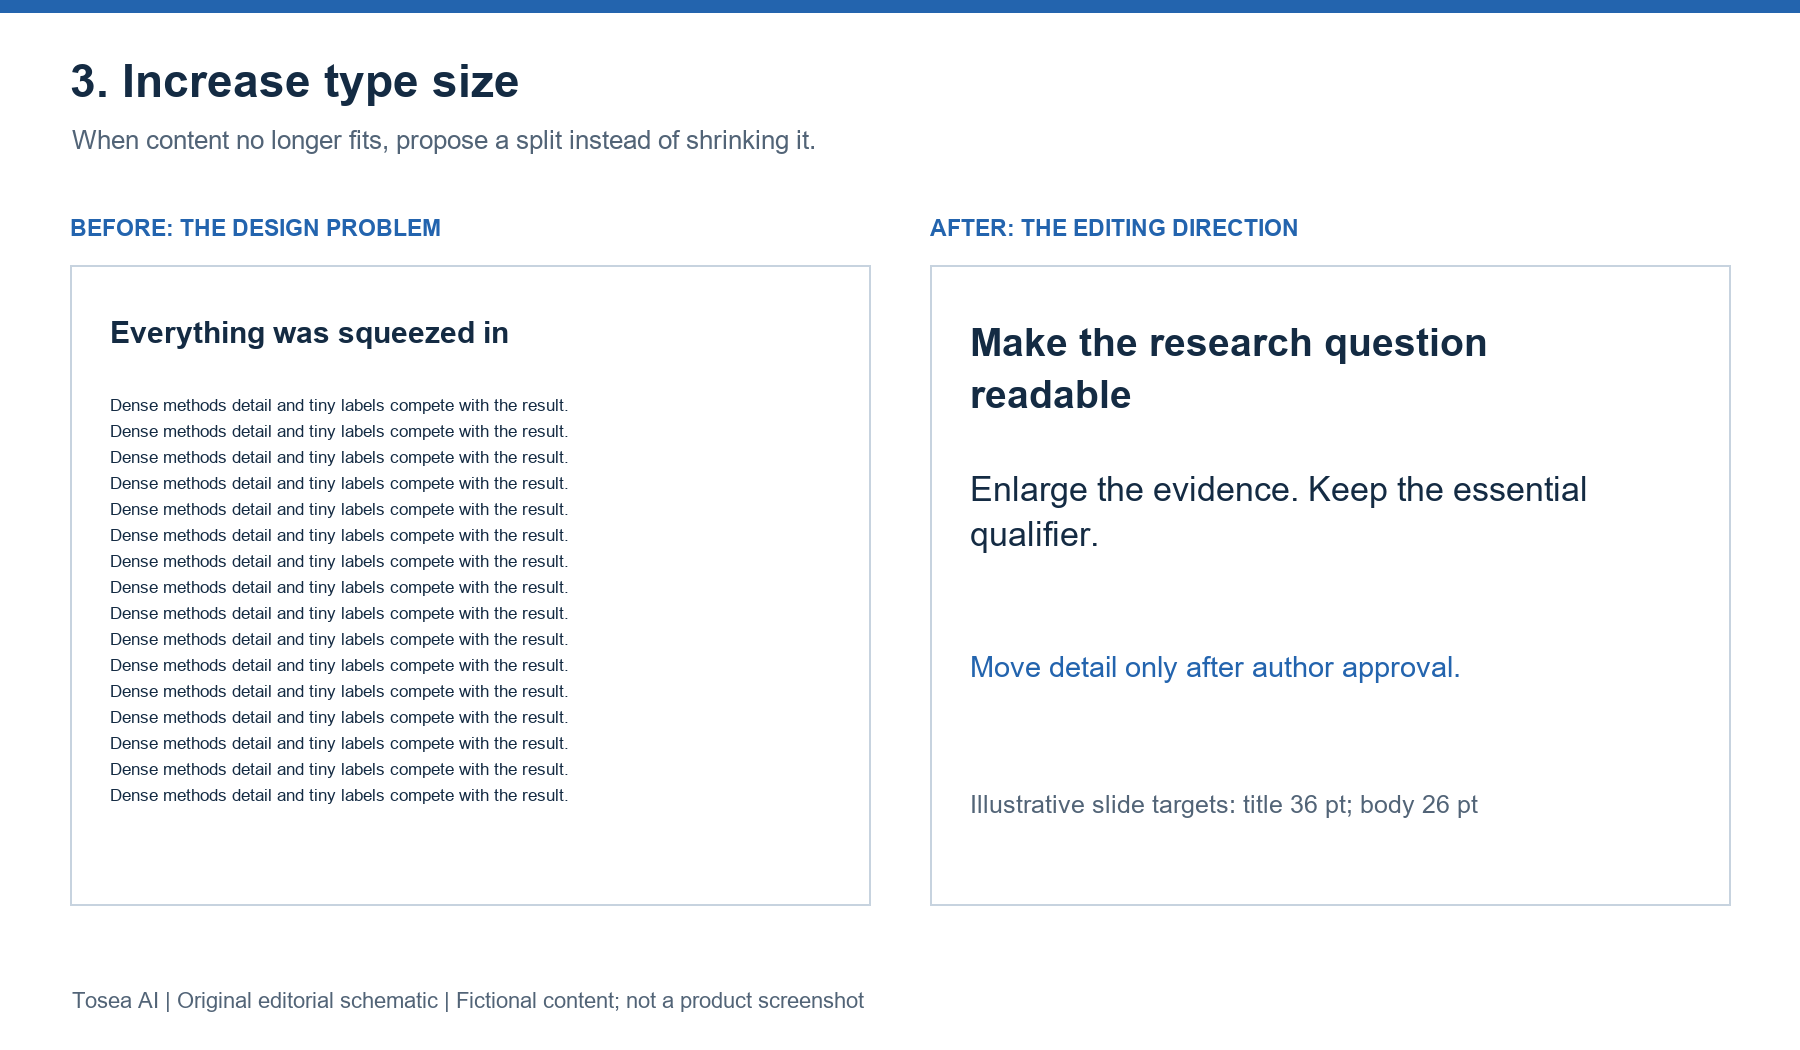
Example: A slide containing a full methods paragraph and a small workflow becomes a visible workflow plus short stage labels. Detailed wording stays in the source until the author approves moving it.
4. Give the main result most of the slide
Research audiences need to inspect the comparison, not just read an interpretation. A result slide should expose sample size, units, uncertainty, and the limits of the claim.
Rebuild [results slide] around its approved finding from [paper page, figure, or table]. Use one qualified message title, one enlarged evidence panel, and a short interpretation beside it. Preserve the original figure, axis definitions, sample sizes, uncertainty intervals, and citation. Distinguish reported results from interpretation. Use no-fill text boxes and remove decorative icons. Do not invent observations or redraw a chart from estimated values. If source data are supplied, rebuild the chart reproducibly and reconcile every plotted value. Return the editable source, preview, and a list of preserved scientific details.
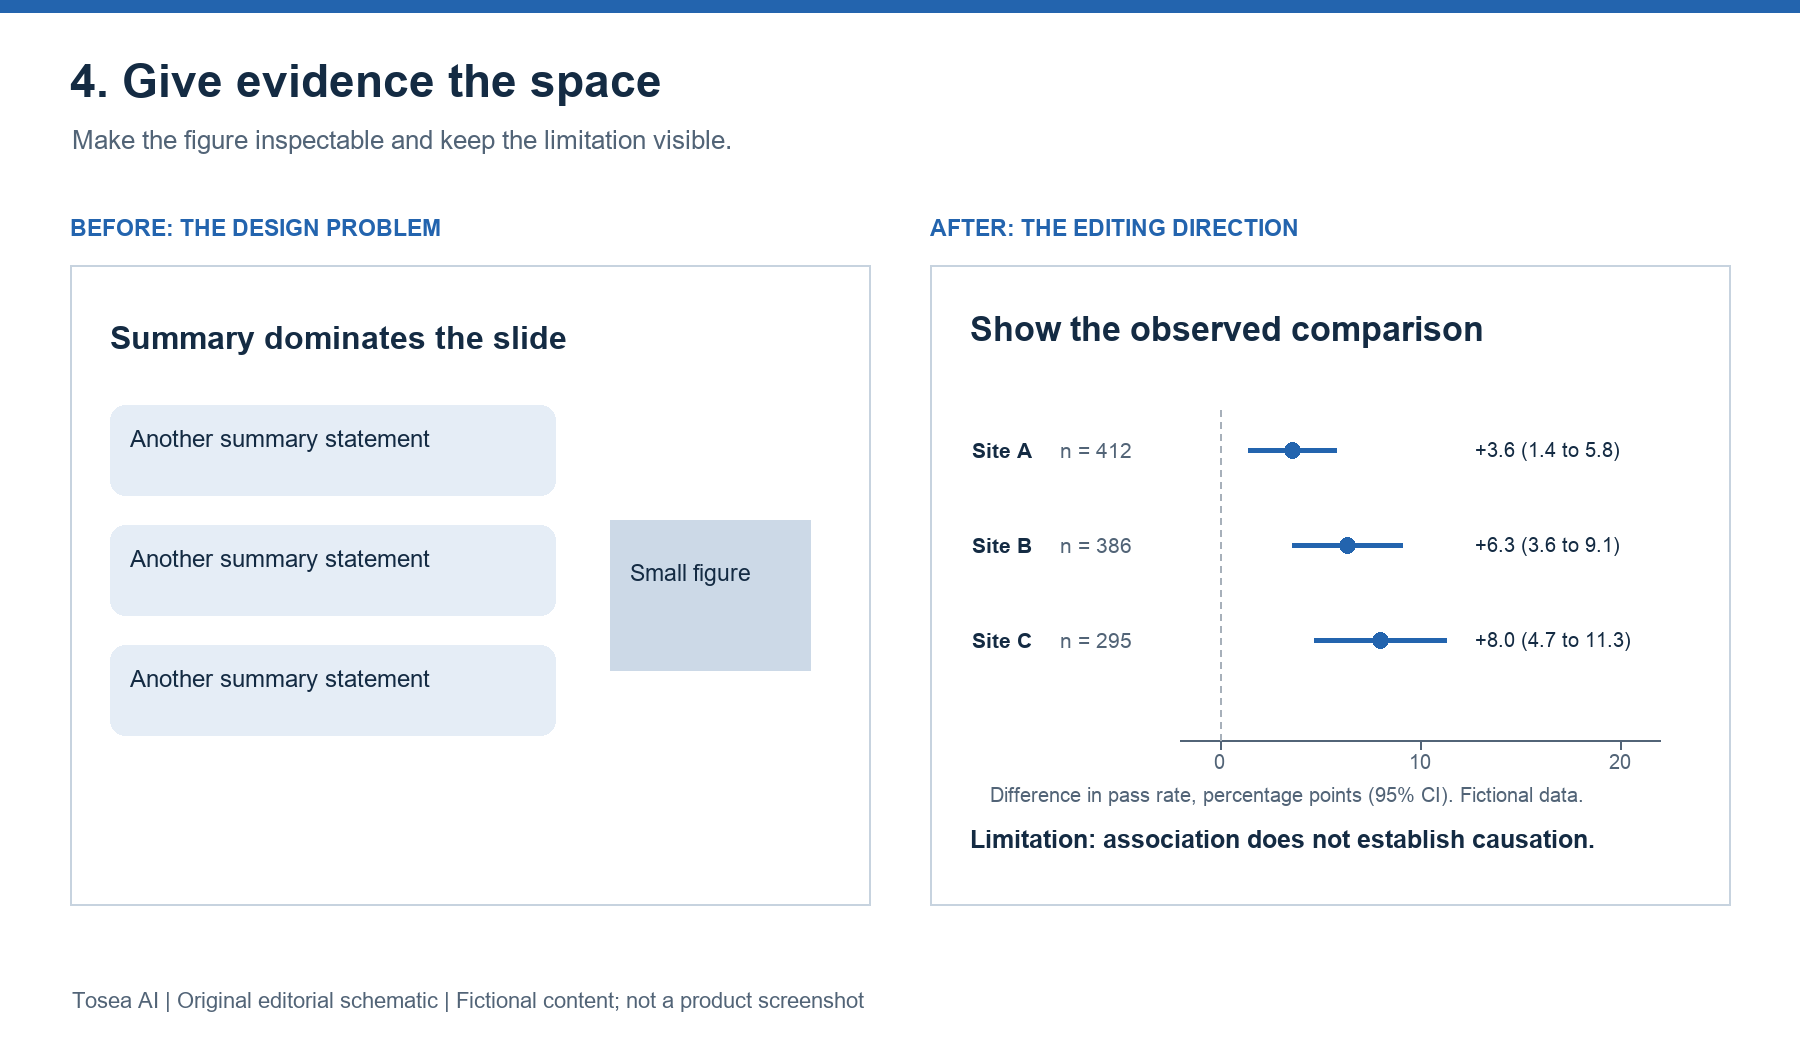
Example: For an observational association, the title retains the population and direction of association. The interpretation does not become a causal claim merely because the revised slide looks persuasive. In the schematic, every estimate carries its site, sample size, and interval, and the axis states the unit, which is the minimum a reader needs to check the claim. Our research presentation prompts include a separate prompt for results and uncertainty slides if you are building the deck from scratch.
5. Replace generic research copy with precise claims
Visual cleanup cannot repair exaggerated language. Run this separately from layout-only work because it intentionally proposes wording changes.
Edit the proposed text in [deck] using only [approved sources]. Replace generic praise, repetitive transitions, and unsupported superlatives with specific claims. For every proposed replacement, provide the original text, revised text, supporting page or figure, and reason. Separate paper-reported findings, prior-literature conclusions, reasonable inference, and unresolved uncertainty. Preserve statistical qualifications, terminology, and units. Define unfamiliar acronyms at first use. Suggest concise message titles without overstating the evidence. Return a review table first; apply wording changes only after approval. Leave the current slide wording untouched during this review.
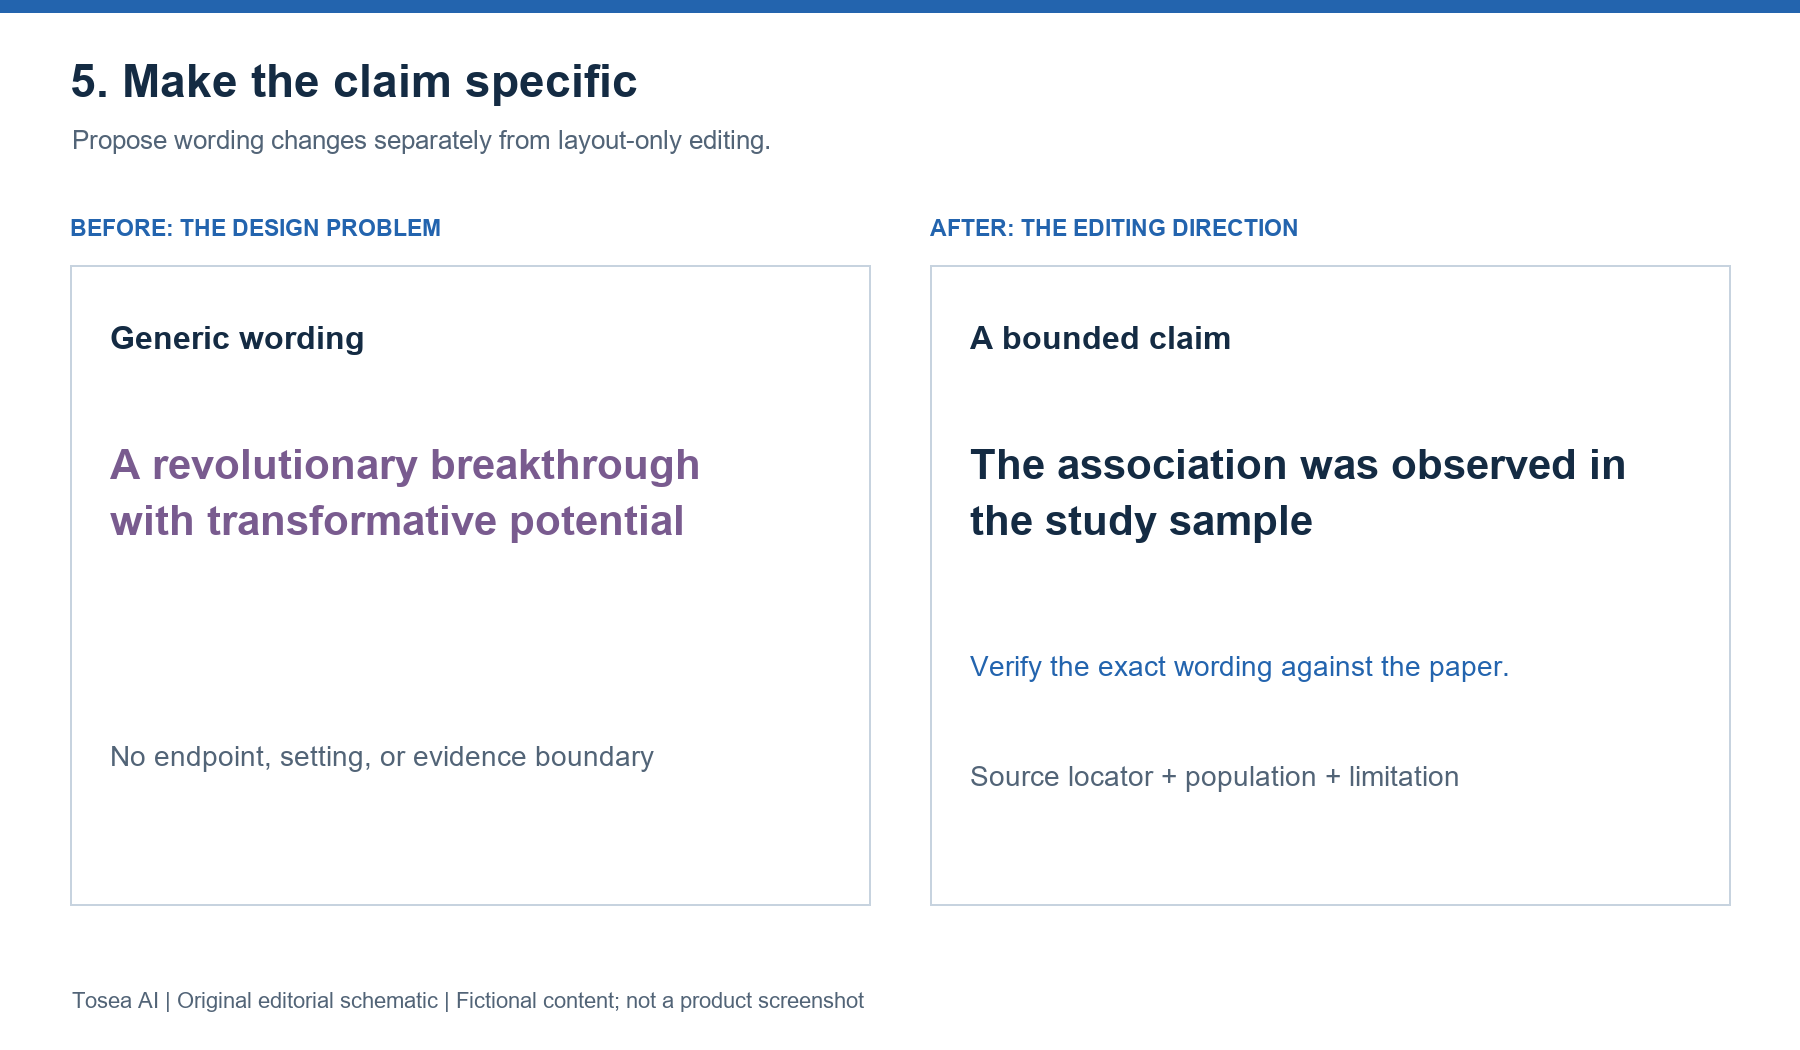
Example: A vague statement about transformative potential becomes a bounded statement about the measured endpoint and study setting. When the source supplies no quantitative result, the prompt must not manufacture one.
6. Run a deck-wide visual and evidence audit
This final pass catches problems that slide-by-slide editing misses: changing legends, inconsistent margins, missing references, and a conclusion stronger than the results.
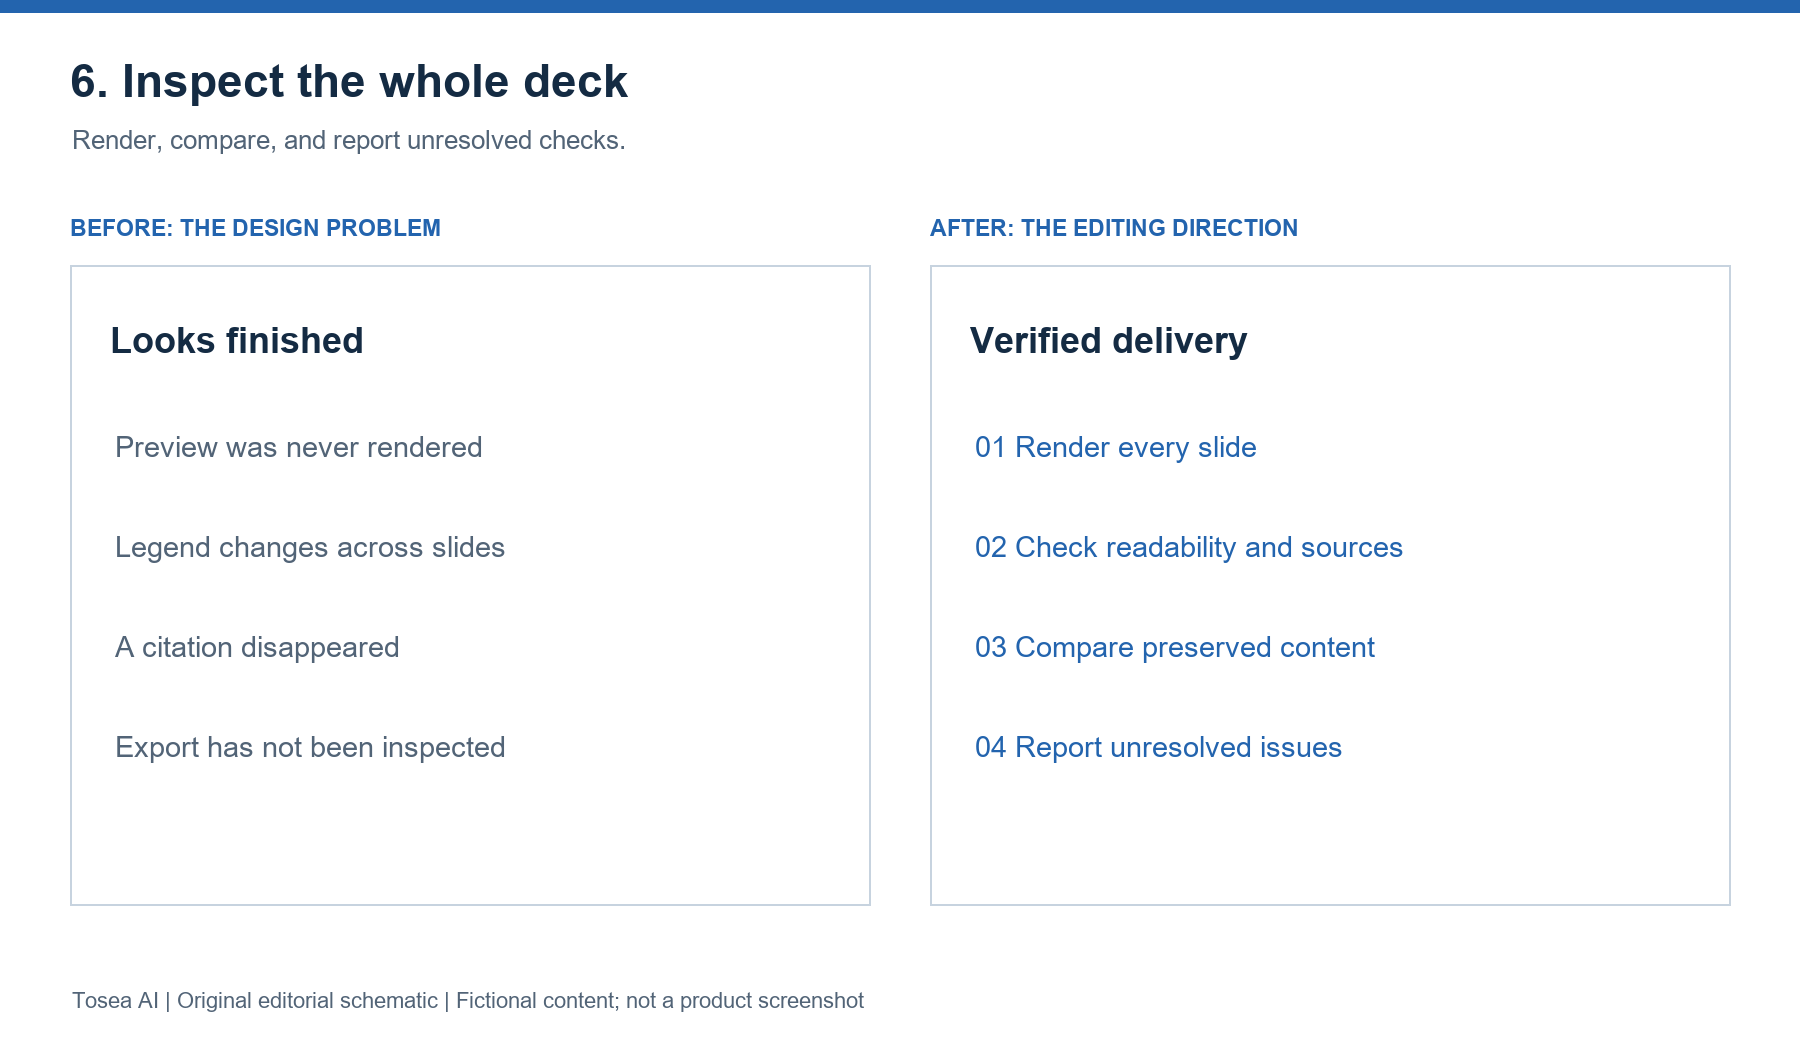
Audit [deck] for [audience] and [talk duration]. Render every slide with the available renderer and inspect the previews. Check title hierarchy, margins, recurring colors, font sizes, overflow, figure legibility, citations, units, and uncertainty labels. Compare approved wording and numerical values with the supplied sources. Flag unsupported conclusions. Keep meaningful variation between method, results, and discussion layouts. Return an issue log with slide number, problem, severity, proposed fix, and verification status. Apply visual fixes that preserve content. Request approval for wording changes or slide splits. Mark unavailable checks explicitly; never report an unperformed check as passed.
Which order to run the prompts in
The numbering above follows the order in which problems become visible, not the best order to fix them. On a real deck, this sequence wastes less work:
- Run prompt 6 first, report only. As written, prompt 6 applies visual fixes, as it did in our test, so append "Report only; do not apply fixes yet." The issue log tells you which slides need prompts 1 to 4 and catches number mismatches before you spend time restyling a slide that contains a wrong value.
- Fix the numbers and claims (prompt 5). Approve wording changes against the paper before redesigning, so the layout is built around the final text.
- Run prompts 1 to 4 for the flagged slides. Layout, palette, type, and the results slide, in that order, because removing cards changes the space available for type and evidence. In our test, the audit alone left every card in place, so prompt 1 still has to run.
- Run prompt 6 again. The second audit verifies that the visual passes did not drop a citation, change a legend, or reintroduce overflow.
Keep each pass in its own commit or file copy. If a later pass breaks something, you can compare against the previous version instead of the original.
Use Tosea AI to simplify the redesign workflow
Tosea AI is our product, and it gives researchers a visual workflow for making these decisions without writing scripts. Upload your source material, review the outline, and choose a layout or diagram for individual pages. You can continue adjusting layouts after generation. Request open layouts, restrained colors, and larger labels explicitly. If you are starting from a paper, our research paper to slides workflow walks through the full document-to-PPT process.
For an existing deck, Beautify PPT/PDF accepts PDF or PPTX on Pro and above. Choose Keep source pages when preserving content and sequence matters, select a template, and review the extracted outline. Use Layout Only for subsequent visual changes. Compare the output with the source, especially small figure labels and footnotes. Our guide to beautifying a PowerPoint without changing the content shows that process step by step.
Data Studio can recognize chart data or import Excel and CSV, then create editable tables and charts. Verify recognized values against the original before updating a slide. Changing a palette should never change the evidence.
Frequently asked questions
Does Claude Code need extra tools to edit a PowerPoint file?
Yes. Claude Code works through the files and commands available in your project. To edit a .pptx, it needs a library such as python-pptx (or a skill that bundles one). To check what the slides look like, it needs a renderer such as headless LibreOffice plus a way to turn pages into images. Without a renderer, ask it to say so in the report rather than assume the layout is fine.
Can Claude Code tell whether my slides look AI-generated?
It can check concrete symptoms: how many filled containers each slide uses, how many unrelated fill colors appear, the smallest font size, overflow, and whether claims match the source. Whether a deck "looks AI-generated" is a judgment about those symptoms, so ask for the measurements rather than a verdict.
Can Tosea AI redesign my existing PowerPoint without changing the content?
Yes. Export it as a PDF or upload its PPTX through Beautify. Select Keep source pages and request preservation of wording and figures. Review every label and footnote afterward.
How do I upload a PowerPoint and ask Tosea AI to redesign each slide?
Upload the PPTX or exported PDF through Beautify, choose a template, and specify the visual direction. Review the outline and every generated slide before exporting the revised presentation.
Can I upload my own PowerPoint template to Tosea AI?
Yes, custom templates are supported on the Pro and Max plans. Verify required layouts, fonts, colors, logo placement, and master-slide requirements in the result.
Can Tosea AI use custom brand colors, fonts, and a logo?
Specify your colors and fonts, supply the logo, or use a supported custom template. Feature access depends on your plan. Check font availability, contrast, color values, and logo spacing after export.
Can Tosea AI match the style of my old company presentations?
A representative deck can guide design without implying permanent model training. Use an approved custom template for stronger consistency, then compare the output with your current brand guidelines.
Does Tosea AI preserve PowerPoint formatting after export?
Editable PPTX export aims to stay close to the preview. Fonts, complex graphics, and the application opening the file can affect appearance. Test the exported deck in your presentation environment.
Can I tell AI to edit the layout only and keep the exact wording?
Yes. Layout Only is intended for visual changes without rewriting content. Compare the revision with the source to confirm that wording, labels, citations, footnotes, and line breaks remain correct.
Build research slides that feel deliberately designed
The six prompts share one rule: design changes are allowed, evidence changes need approval. For more prompts, continue with our research presentation prompts, the business presentation prompts for ChatGPT and Claude, and our guide to structuring a 15-minute conference talk.
If you would rather not script the redesign, Tosea AI handles the same steps as an AI presentation tool: source review, purposeful layouts, and consistent design, with Beautify for an existing deck. Either way, keep the scientific argument in charge of the design, and verify the final PowerPoint before presenting.
Sources
- Common workflows — Claude Code Docs, Anthropic
- Make your PowerPoint presentations accessible to people with disabilities — Microsoft Support
- Understanding PowerPoint Accessibility — Digital Accessibility Office, University of Colorado Boulder
- python-pptx documentation — python-pptx project
- Data Studio and Beautify an existing PPT — Tosea Help Center